Resource Utilization in Project Planning
You can expand the classic Gantt chart to also display a resource utilization view below.
Show the Resource Utilization View
- Open any project and go to Planning.
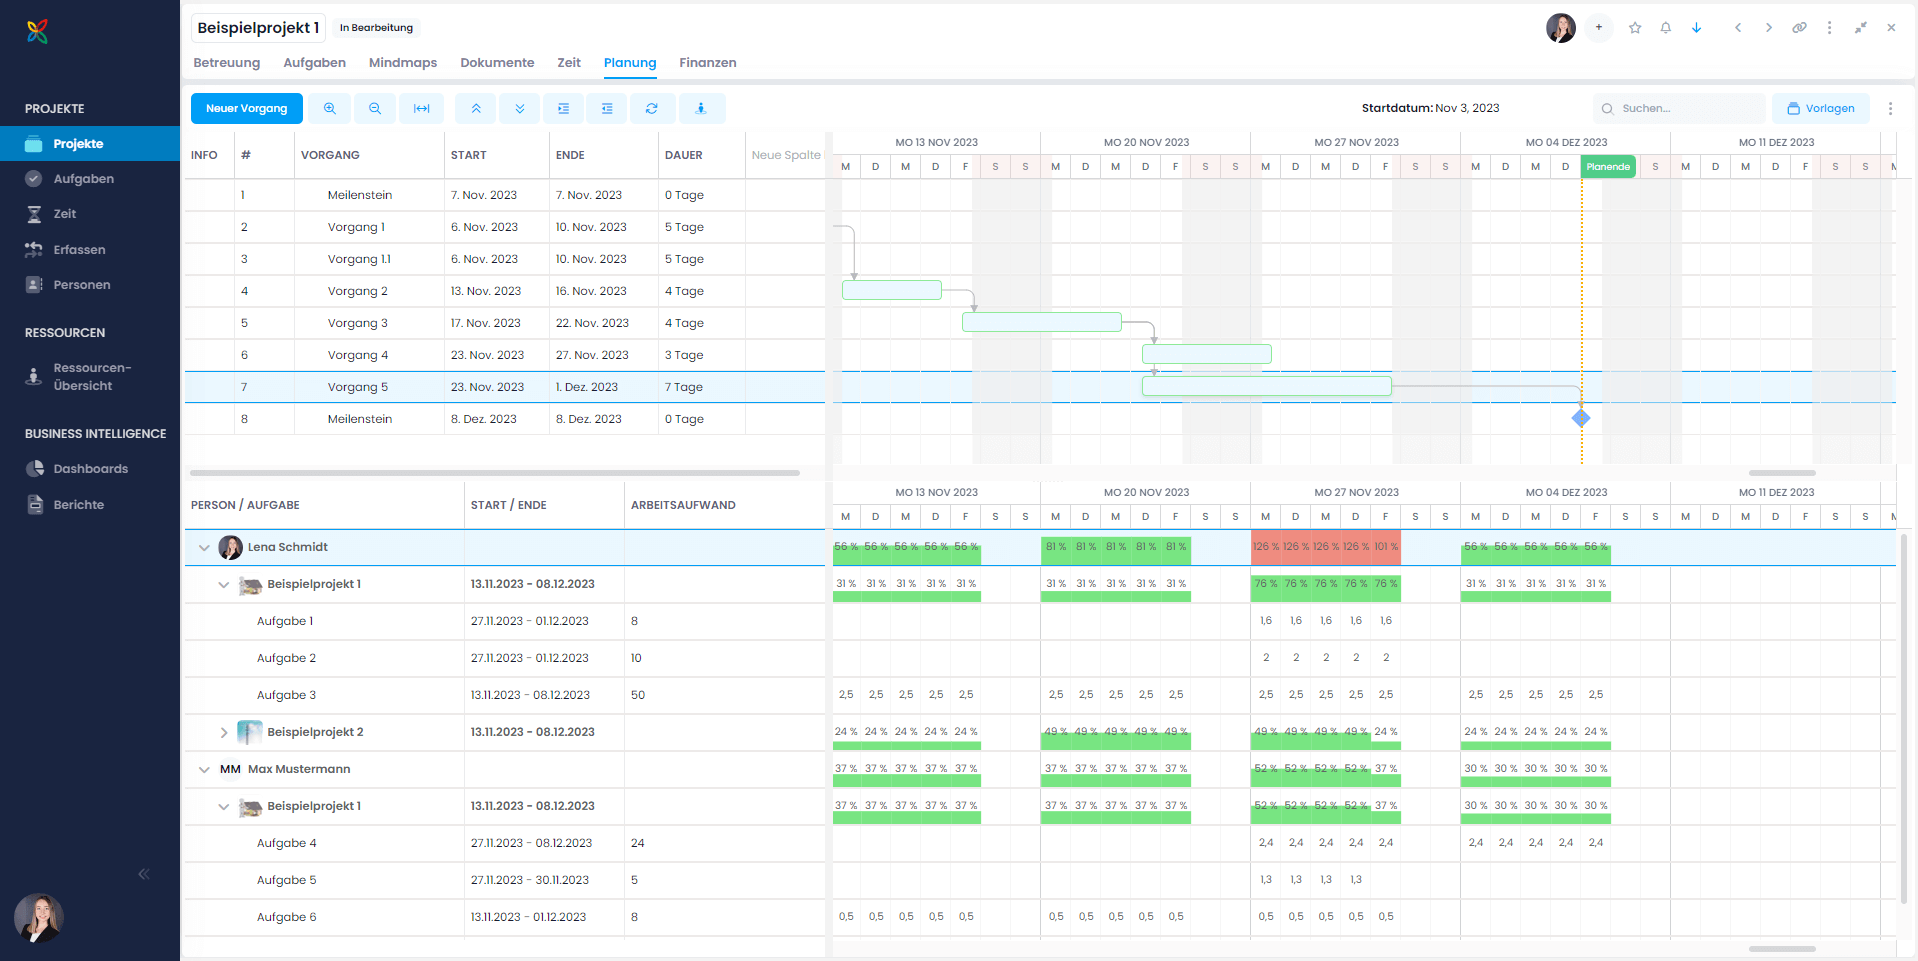
- Click the button with the person icon in the navigation bar to open the resource overview.

The resource utilization of team members who are assigned as resources for tasks in the Gantt chart is displayed directly below the Gantt chart.
Understanding the Resource Utilization Display
Monitor project progress and resource utilization simultaneously:
- At the person level and project level, utilization is shown in %.
- For individual tasks, the number reflects the workload in hours.
- Areas marked in red indicate when a resource is overloaded. Check whether tasks can be redistributed to someone who still has available capacity.
Changes in the Gantt chart — such as shifting activities and their tasks — are reflected in real time in the resource utilization view. This makes it easier to identify bottlenecks and reveals when an optimized distribution of tasks is needed.
Example
In the example above, Lena Schmidt is overloaded during the week of November 27, with utilization at 126% and 101%.
She could be supported by reassigning Task 1 and/or Task 2 to her colleague Max Mustermann — provided he has the appropriate qualifications and knowledge.
To redistribute tasks, simply click the task and change the assigned resource. The change is immediately reflected in the workload view.
For more detailed information, see the Resource Overview help article.