Financials in List View
Switch to the list view by clicking on the list icon.

The list view of a project's financial plans and line items provides a powerful table with columns that can be grouped, filtered, and sorted. You can also export it to Excel.
You need at least reading permissions for project finances to view them. If you have editing permissions, you can also edit existing plans, create new plans, and more.
Tips for working with the list view in Financials:
- Use the expand button to view financials in full-screen mode for better navigation.
- Activate Advanced Mode via the three-dot menu to group and filter columns.
- For detailed instructions on adding columns, grouping, and filtering list views, refer to the help article on List Views.
- For a detailed description of available columns, refer to the help article on Overview Columns in List Views.
Overview of List View Features
The left-hand side shows each of the financial plans in the project. Consider showing these columns for better understanding:
- Planning Type — Displays Plan and Actual labels for planned and actual financial plans.
- Impact — Displays Cost and Revenue labels for expenses and revenues.
- Budget Type — Displays labels such as OpEx, CapEx, CapEx Tasks, OpEx Time, and Benefit.
- Automatic — Displays Yes and No labels for automatically created expenses based on task effort estimates or tracked time.
- Total — Shows the sum of all line items in the specific financial plan in your configured currency.
- Status — Displays Open, Rejected, and Approved labels.
The right-hand side shows the line items of a selected financial plan. Key columns include:
- Name — The name of the line item.
- Group — The budget group assigned to the line item.
- Quantity — The quantity of the line item.
- Purchase Price per Unit — The purchasing price based on the group and quantity.
- Sales Price per Unit — The resale value based on the group and quantity.
- Total — The total cost or revenue generated by this line item.
- Performed by — The assigned resource for the line item.
At the bottom of each list, the sum total of financial plans on the left provides the overall budget gain or loss for the project. The sum total of line items on the right shows the count, overall quantity, and total of all line items in the selected plan.
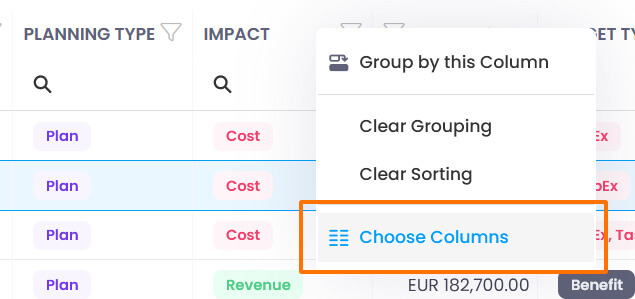
Show More Columns
Right-click a column heading and select Choose Columns from the menu.
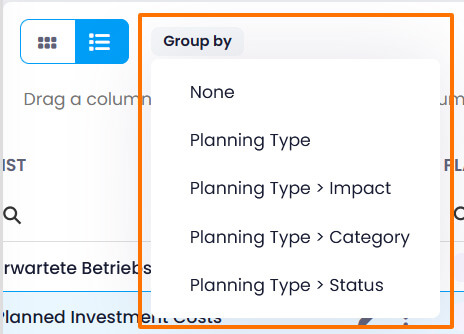
Group Columns
InLoox provides default groups via the Group by button:
- None
- Planning Type
- Planning Type › Impact
- Planning Type › Category
- Planning Type › Status
In Advanced Mode, drag one or more columns into the Drag a column here to group by that column field. InLoox groups according to the order of columns in this field.
Filter Columns
Ensure Advanced Mode is activated. Then either click the Filter icon in the column you want to filter, or click Create Filter at the bottom of the list. The Filter Builder opens for advanced filter rules.
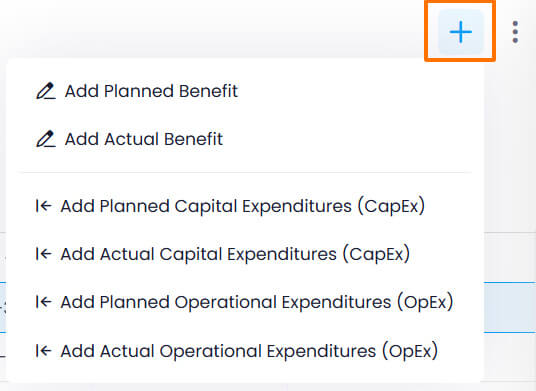
Create New Financial Plans
Click the + Plus button and select the plan type you want to create.
Create New Line Items
Select the financial plan for which you want to create a new line item, then either:
- Click New Line Item
- Click Templates to load a line item template
- Select a line item, click the copy button, then the paste button to duplicate it (works across financial plans)
Turn Planned Revenue into Actual Benefits
- Select a planned revenue plan in the list on the left.
- Click Create Actual Benefit above the line item list on the right.
InLoox automatically creates an actual revenue plan from the line items based on their Sales Price per Unit.
You may need to refresh your browser for InLoox to display the sum in the Total column.
Export to Excel
You can export either the list of financial plans or the line items of a selected plan. Click the three-dot menu and select Export to Excel.
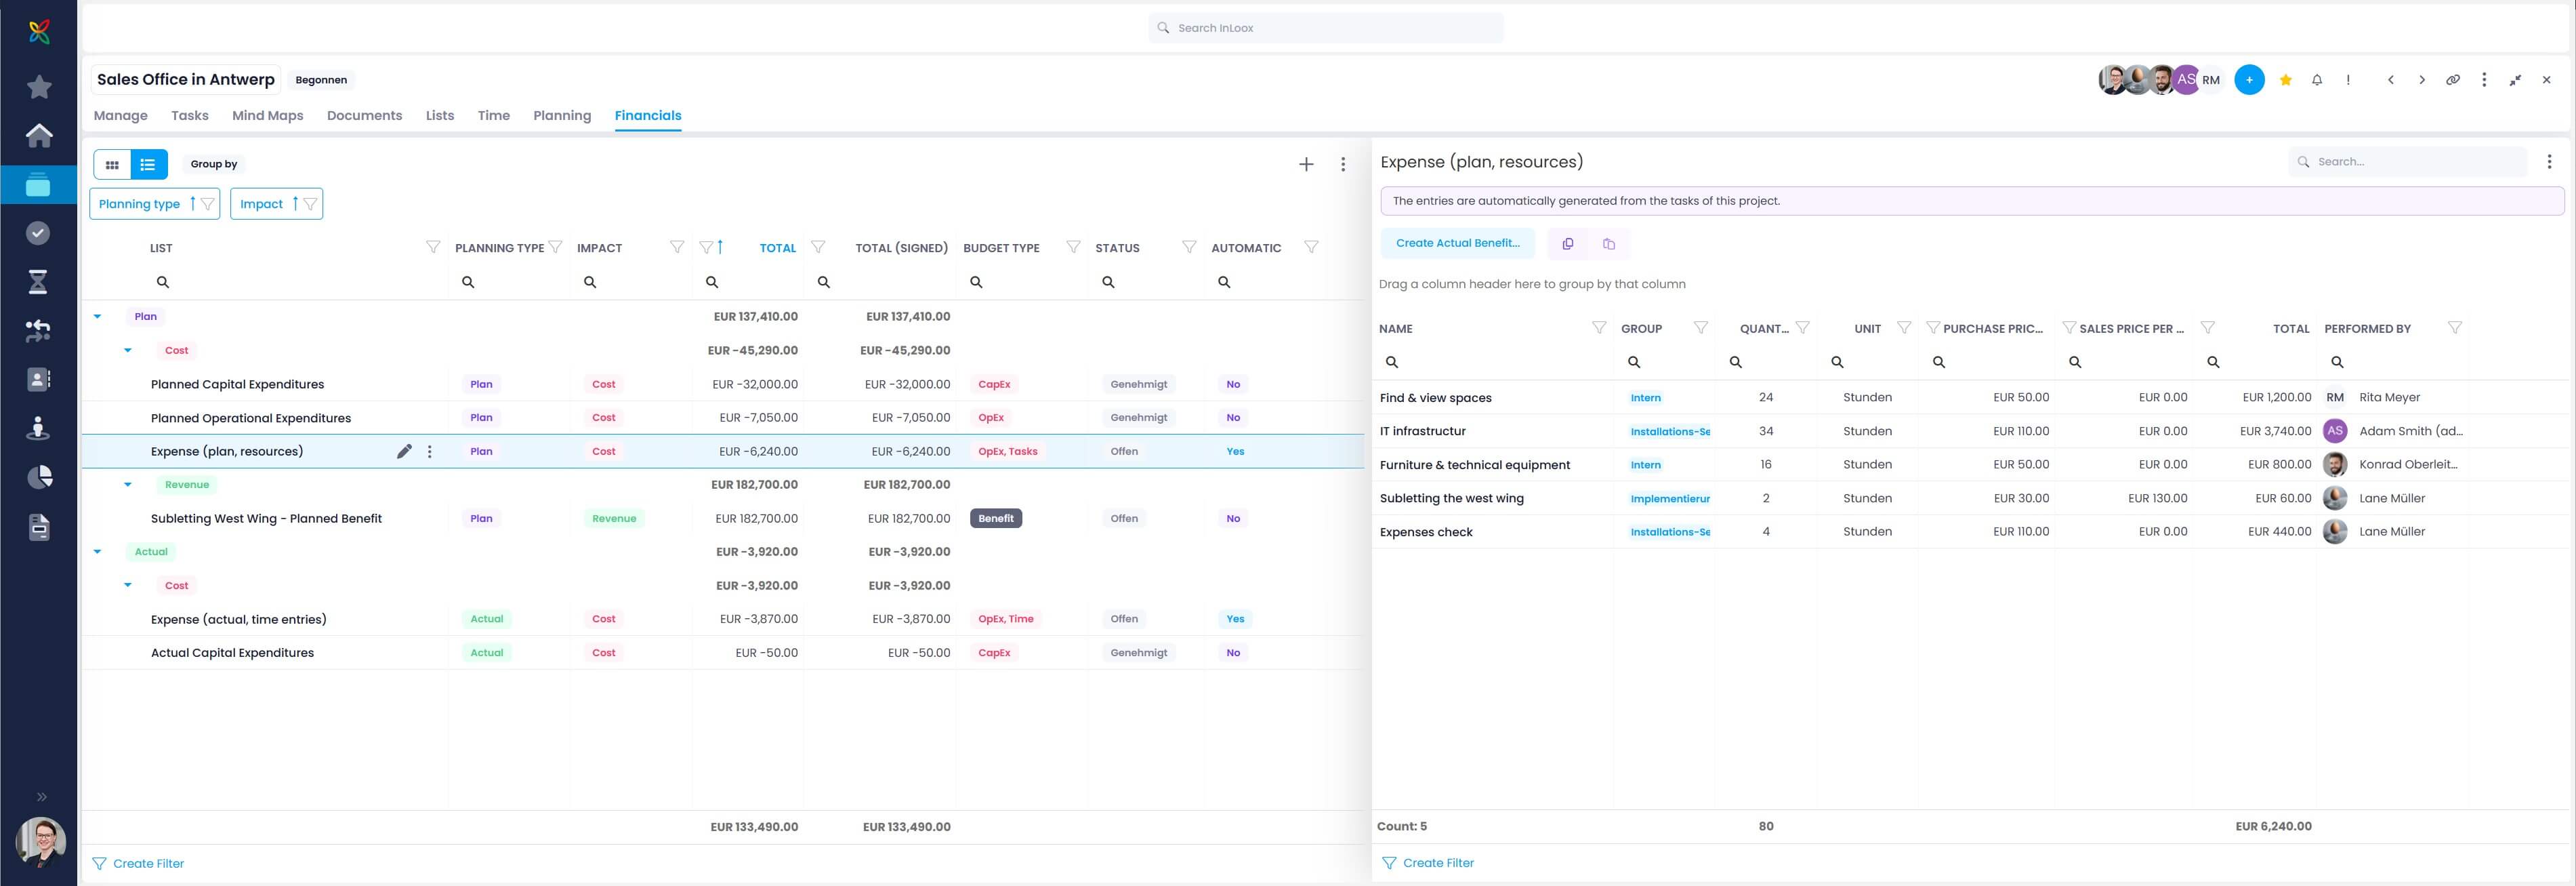
Example: Grouped List View
In this example, the costs and revenues of a new sales office in Antwerp are calculated. On the left-hand side, all financial plans are grouped by planning type and impact.
At a glance, you can see:
- The expected subletting income of $182,700.00 is offset by planned costs of $45,290.00, resulting in a positive margin of $137,410.00.
- Of the planned costs, $6,240.00 stem from estimated task workload, but only $3,870.00 has been recorded as actual expenditure via time entries.
- The margin of planned costs and income to actual costs is currently $133,490.00 — this will decrease as further time is tracked and expenses are billed.
- Planned expenses from tasks totaling $6,240.00 have not yet been approved and should be reviewed.