Dashboards
General Information
- Project Dashboard and Multi-Project Dashboards are available in InLoox Enterprise, Enterprise Plus, and Self-Hosted editions.
- InLoox offers a dashboard within each project (available since InLoox 12.4, September 2025) as well as multi-project dashboards for cross-project analysis.
- Dashboards can be edited, saved as templates, downloaded, and uploaded.
- You need at least read or editing permissions to access dashboards and view data in widgets.
For advanced users, we recommend the Dashboard and Reports Workshop, available as an on-site or online training session.
Access and Edit the Project Dashboard
Open a project and click the Dashboard tab. The project dashboard displays real-time project data. You can add widgets directly or open the Dashboard Designer to make more extensive edits.
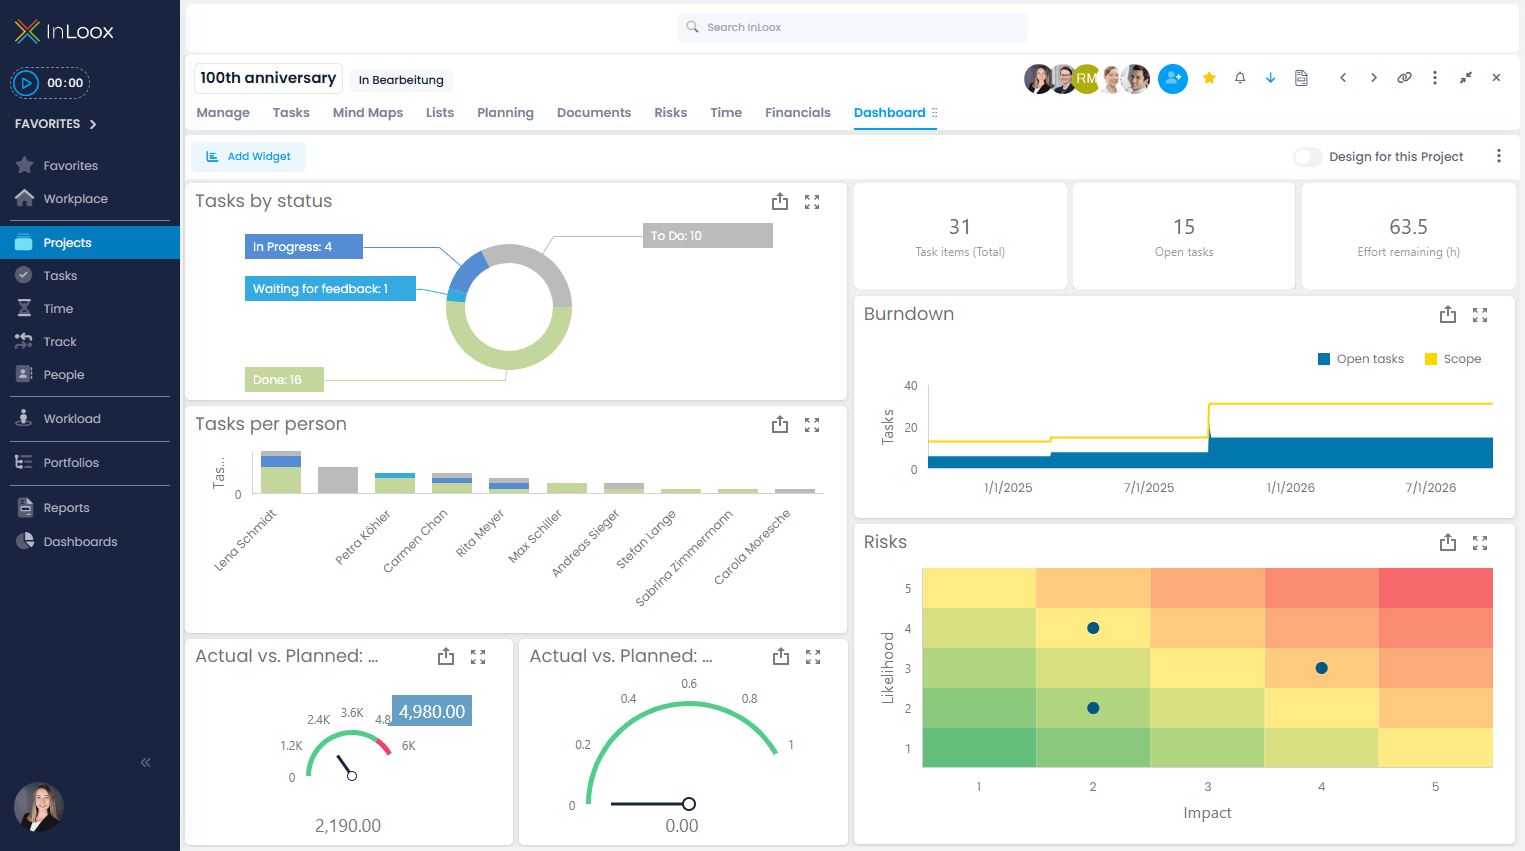
Project dashboard widgets include:
- Tasks by Status
- Tasks per Person
- Actual vs. Planned: Costs
- Actual vs. Planned: Benefits
- Task Items (Total)
- Open Tasks
- Effort Remaining (h)
- Burndown
- Risks
If widgets show no data, verify that the project contains data and that you have at least reading permissions.
Undo Changes to a Project Dashboard
To revert a project dashboard to its default state:
- Click the three-dot menu (⋯) in the dashboard toolbar.
- Select Reset Dashboard.
Turn a Project Dashboard into an Organizational Standard
To set a project dashboard as the default for your organization:
- Click the three-dot menu (⋯).
- Select Set as Organizational Default.
To revert to the original default:
- Click the three-dot menu (⋯).
- Select Reset Organization Default.
Access and Edit Multi-Project Dashboards
Click Dashboards in the left-hand menu under Business Intelligence.

Multi-Project Dashboard Templates
InLoox provides a set of ready-made dashboard templates for common use cases:
| Template | Description | Preview |
|---|---|---|
| Project KPIs | Key performance indicators across all projects | 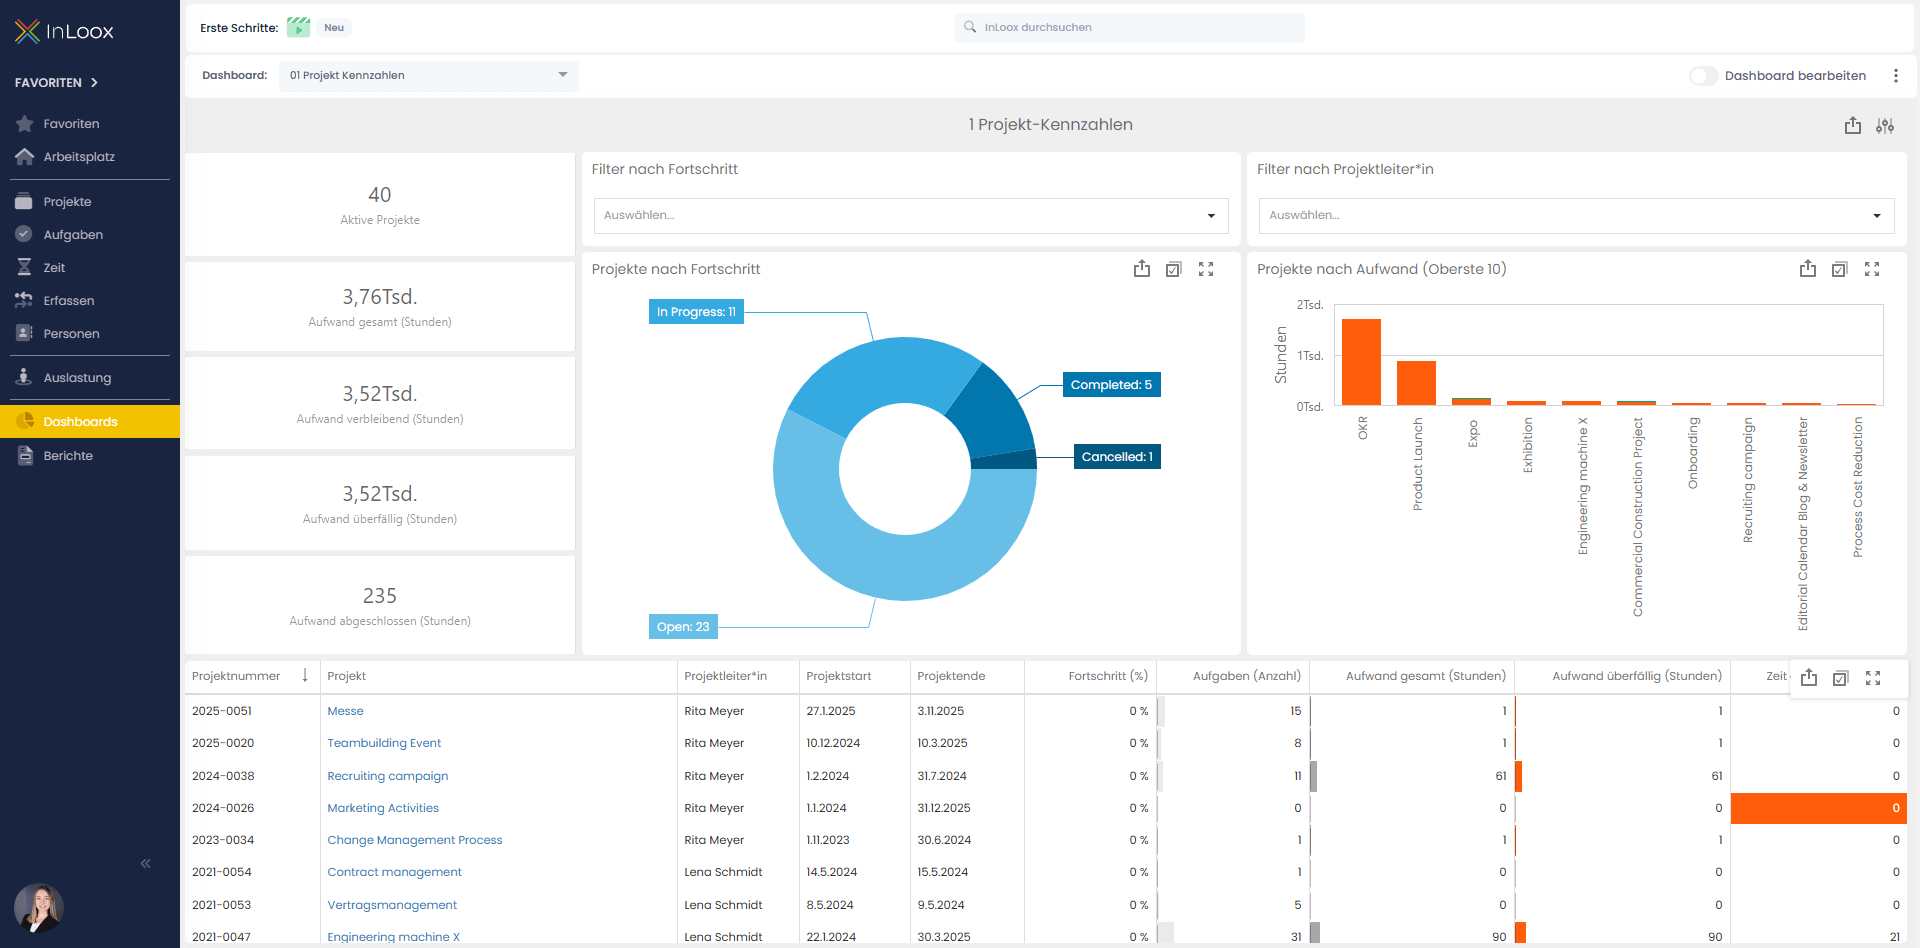 |
| Project Milestones | Overview of milestones across projects | 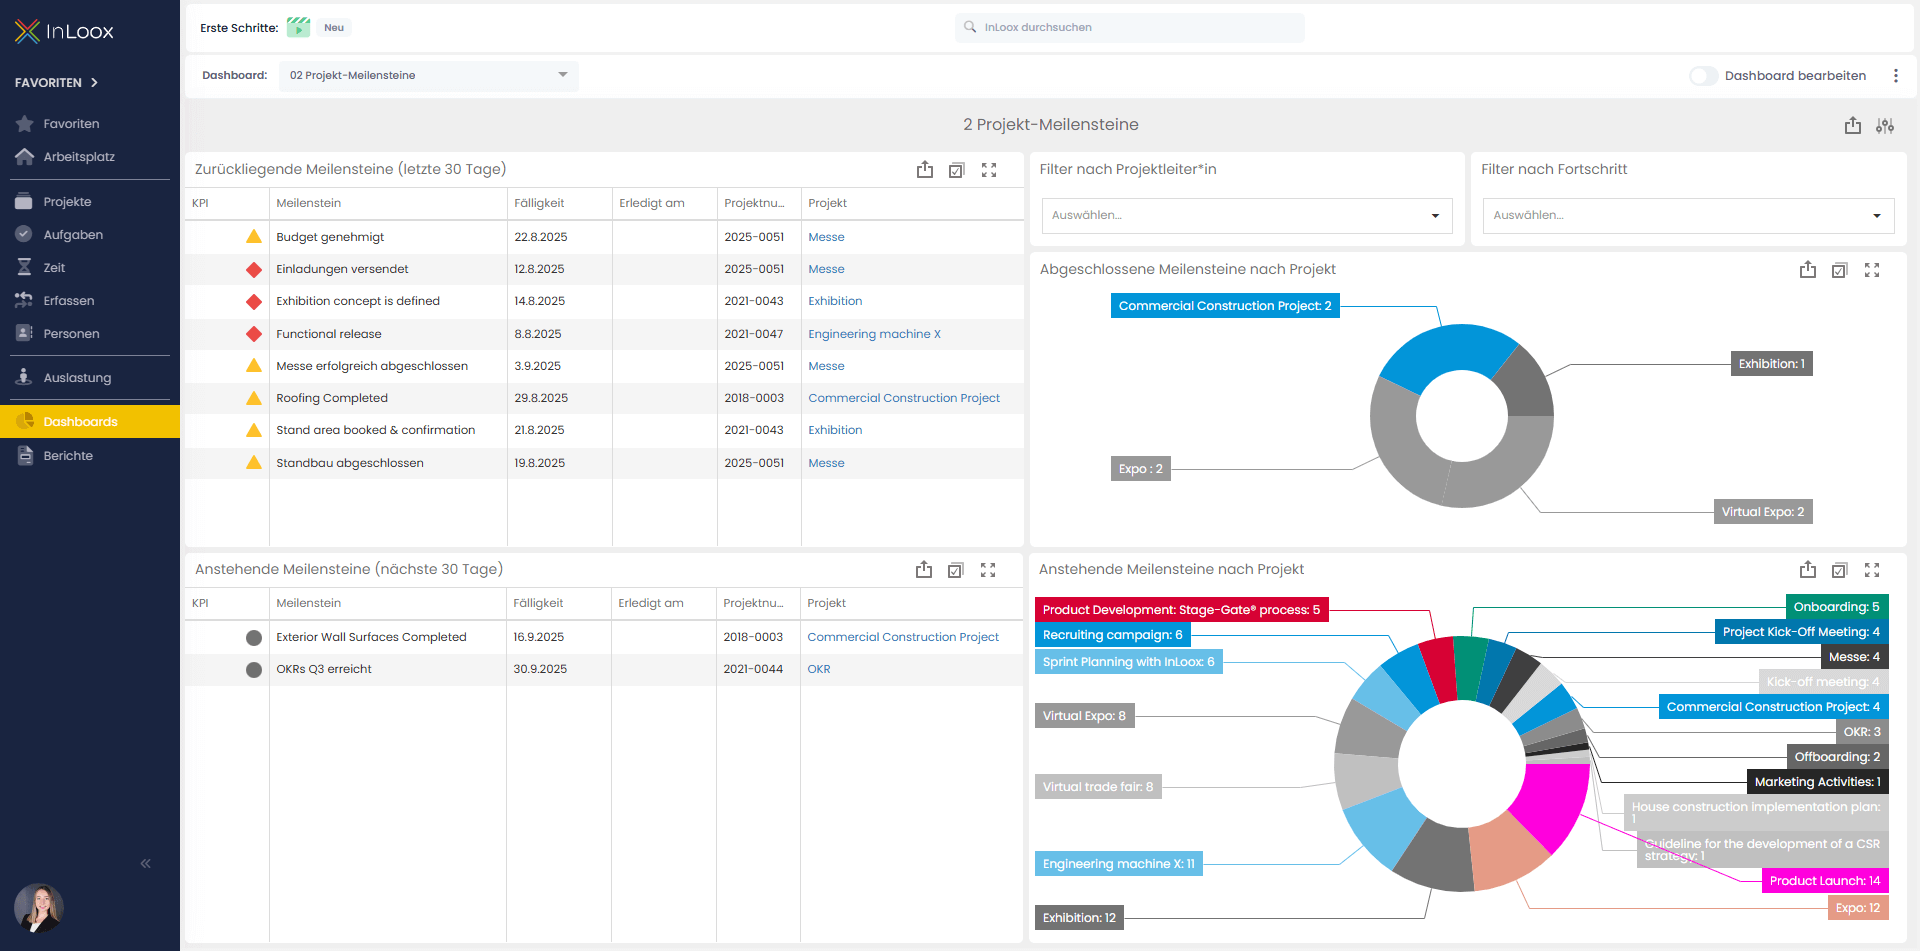 |
| Task Insights | Detailed analysis of task distribution and progress | 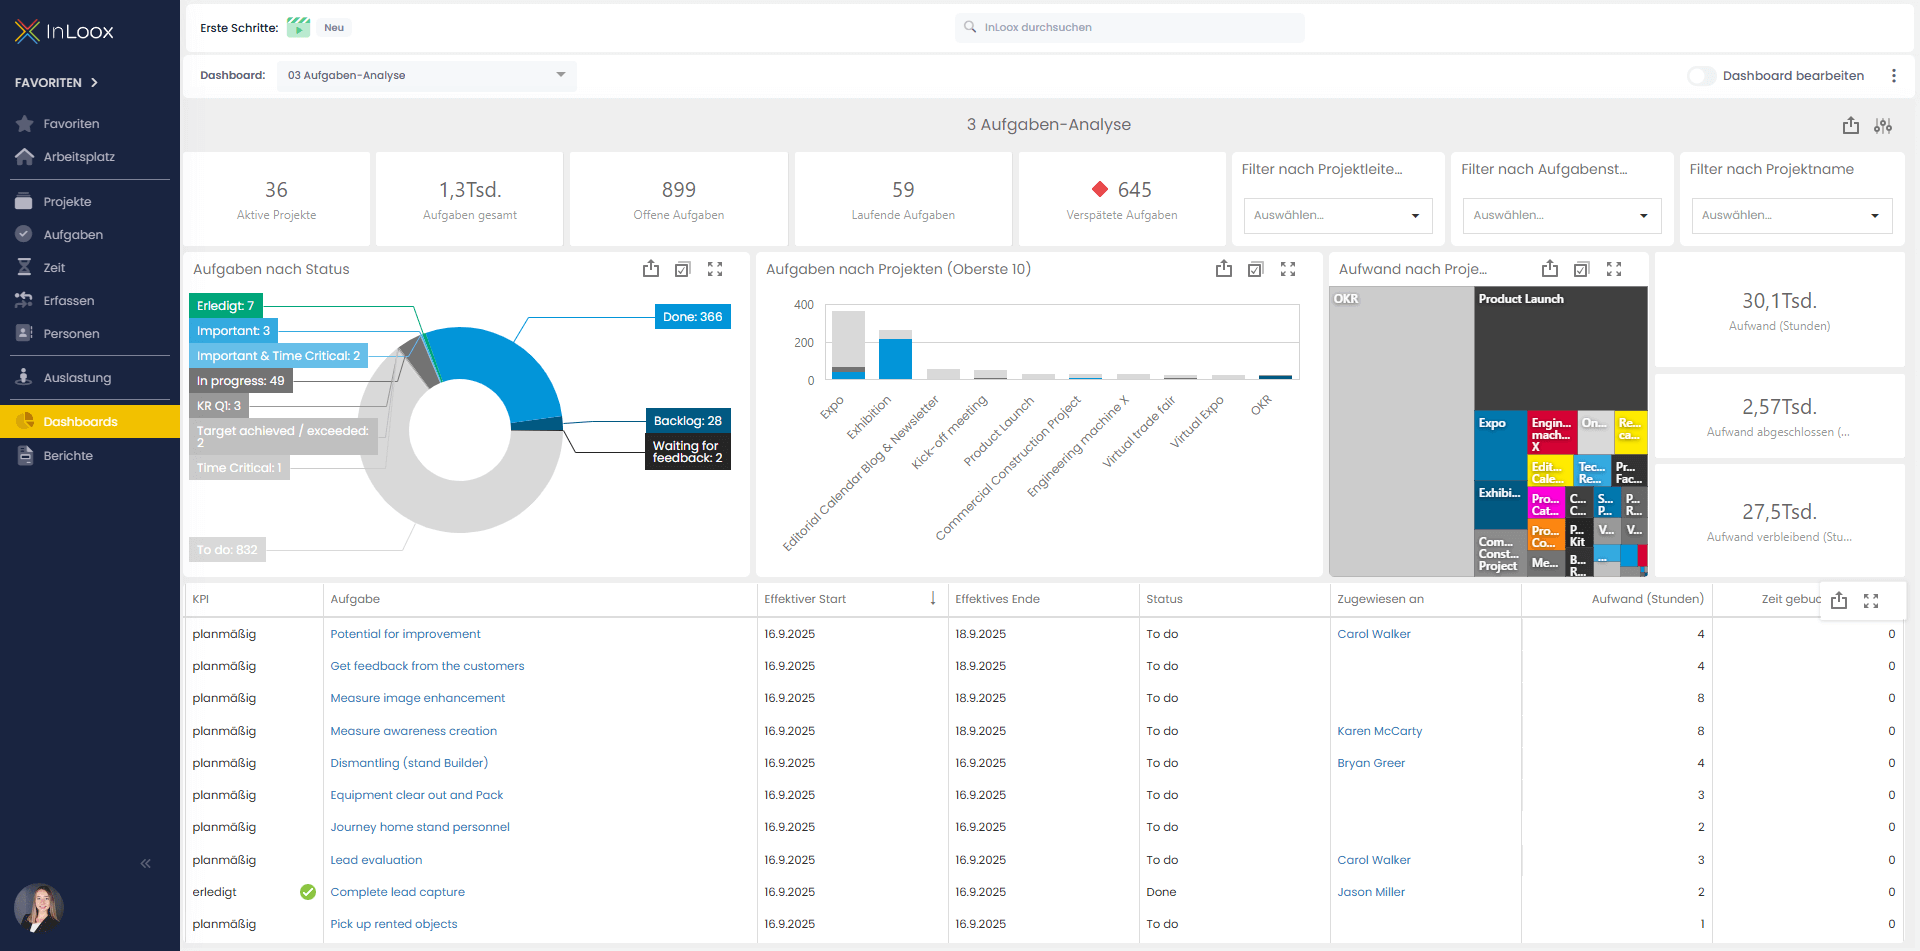 |
| Resource Insights | Workload and availability across resources | 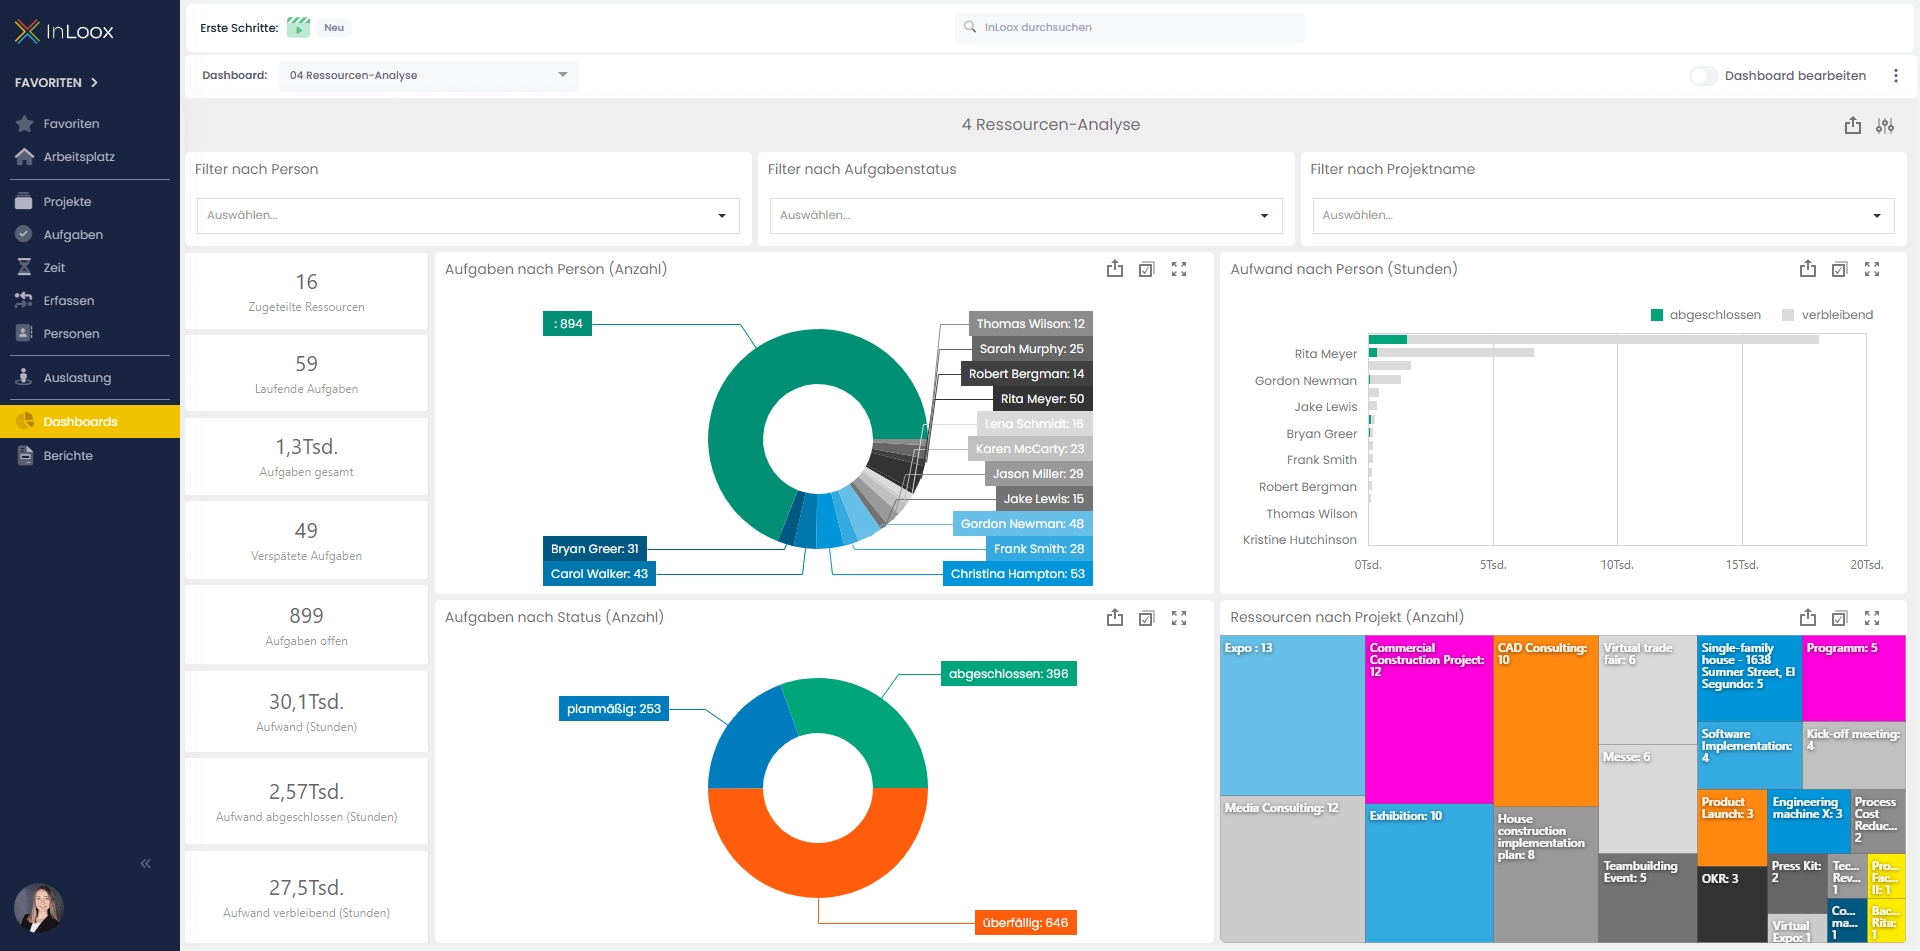 |
| Resource Effort Plan-Actual | Comparison of planned vs. actual resource effort | 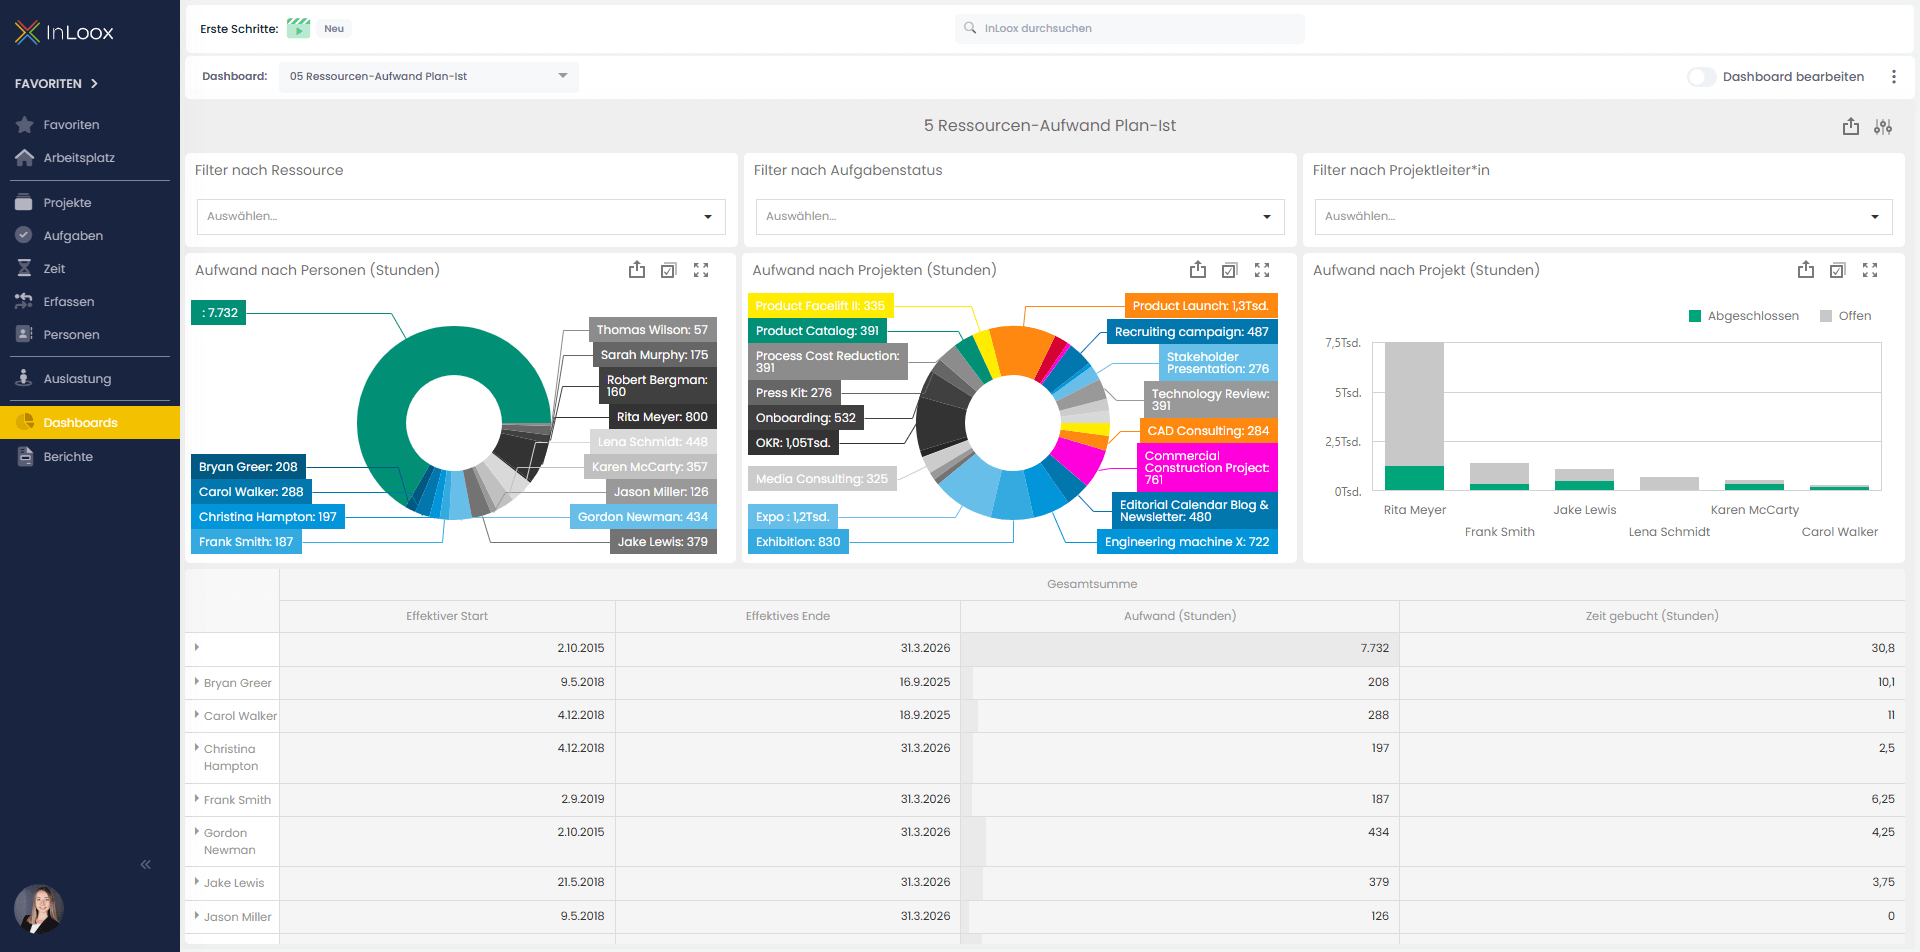 |
| Financials Plan-Actual | Planned vs. actual financial data | 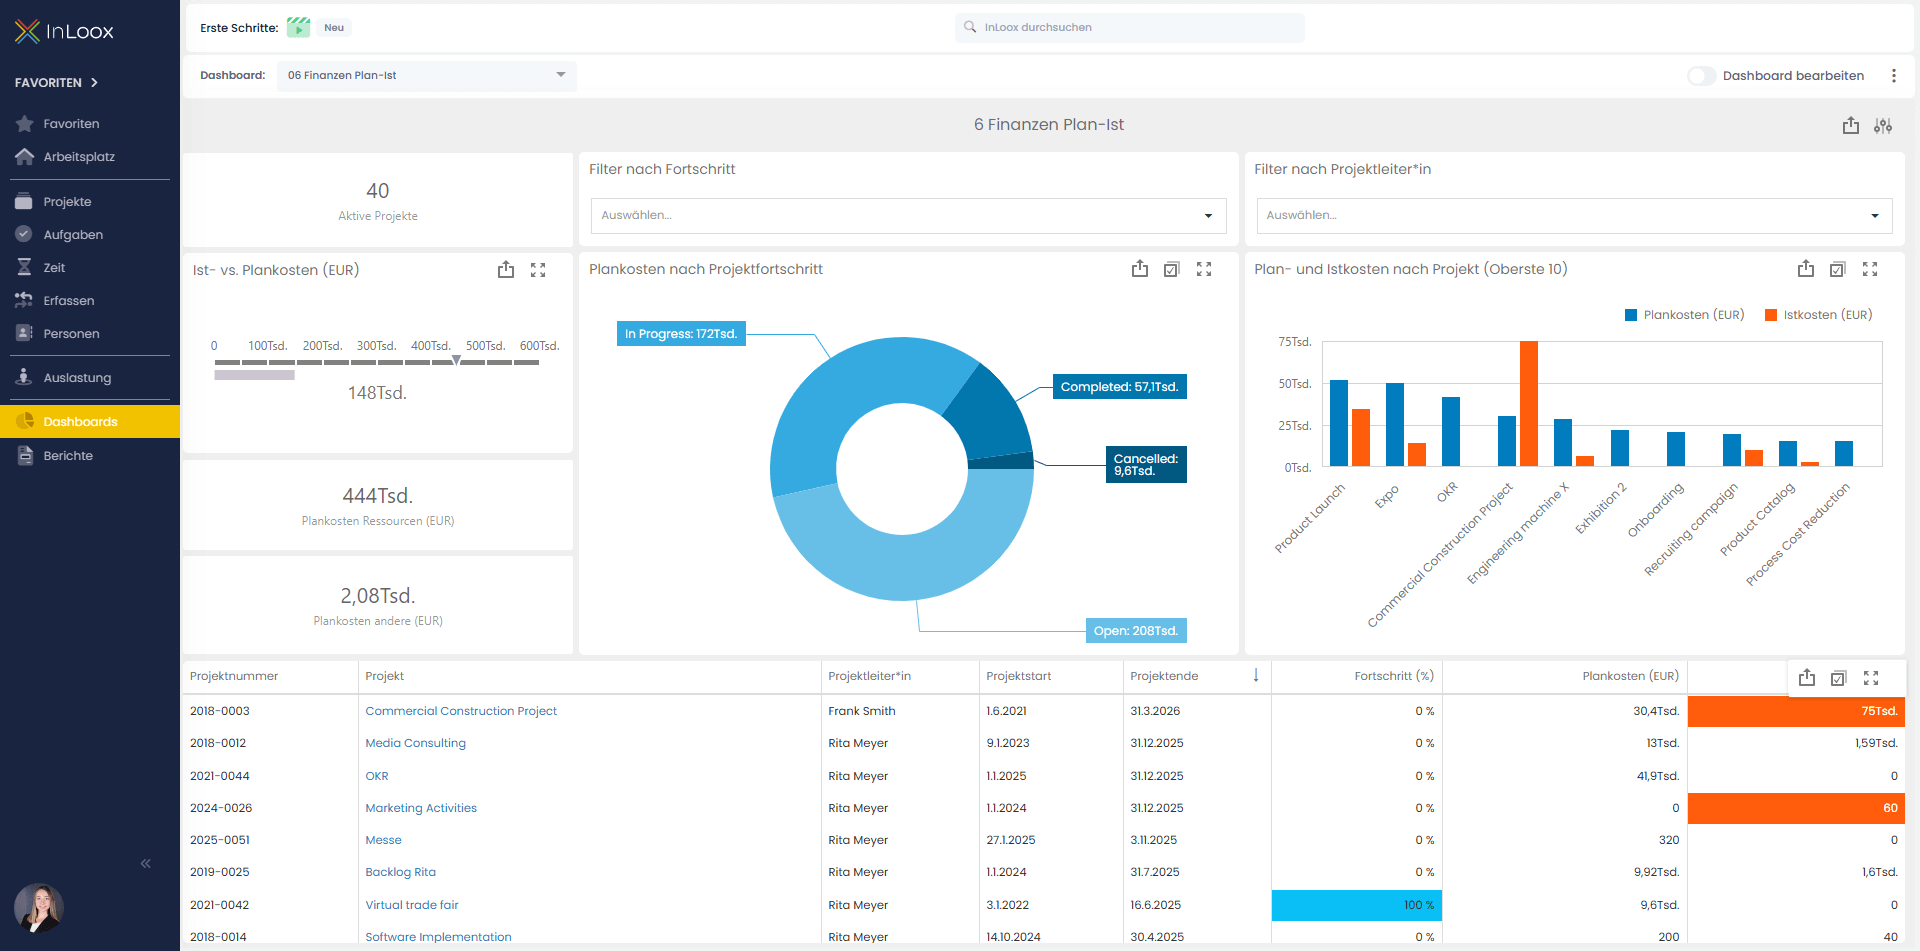 |
| Project Value | Earned value analysis for projects | 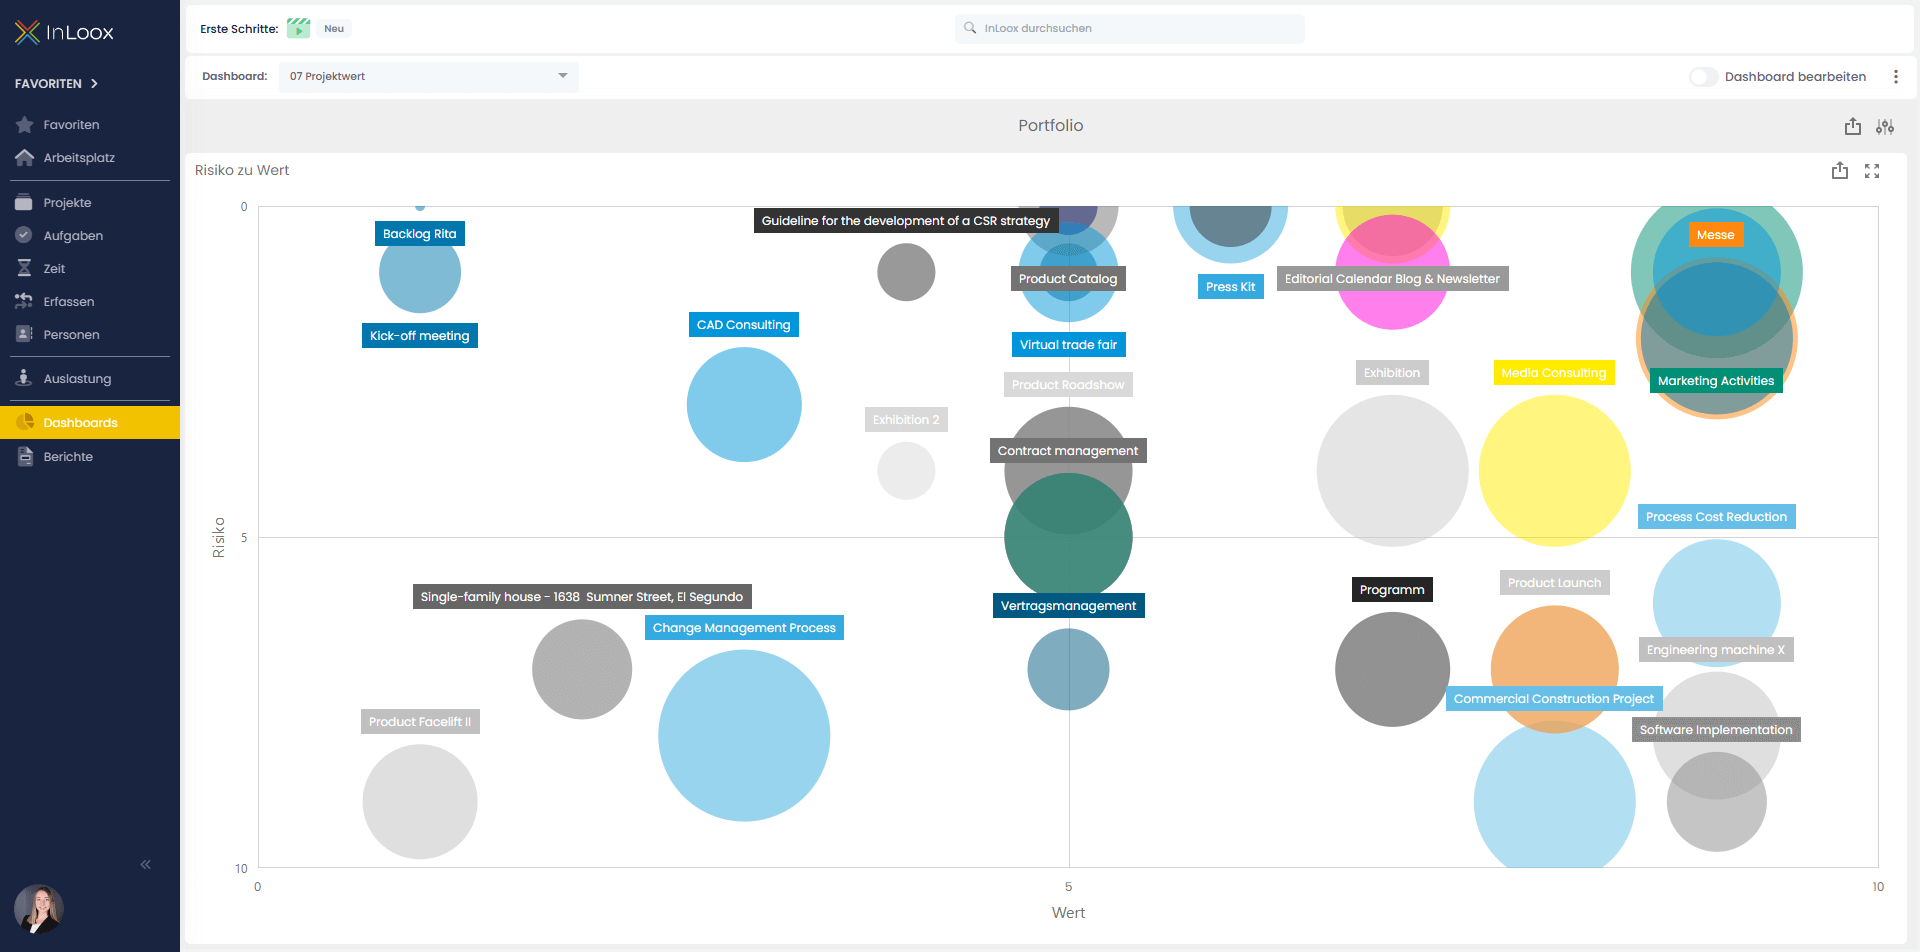 |
| Budget Overview | High-level budget summary across projects | 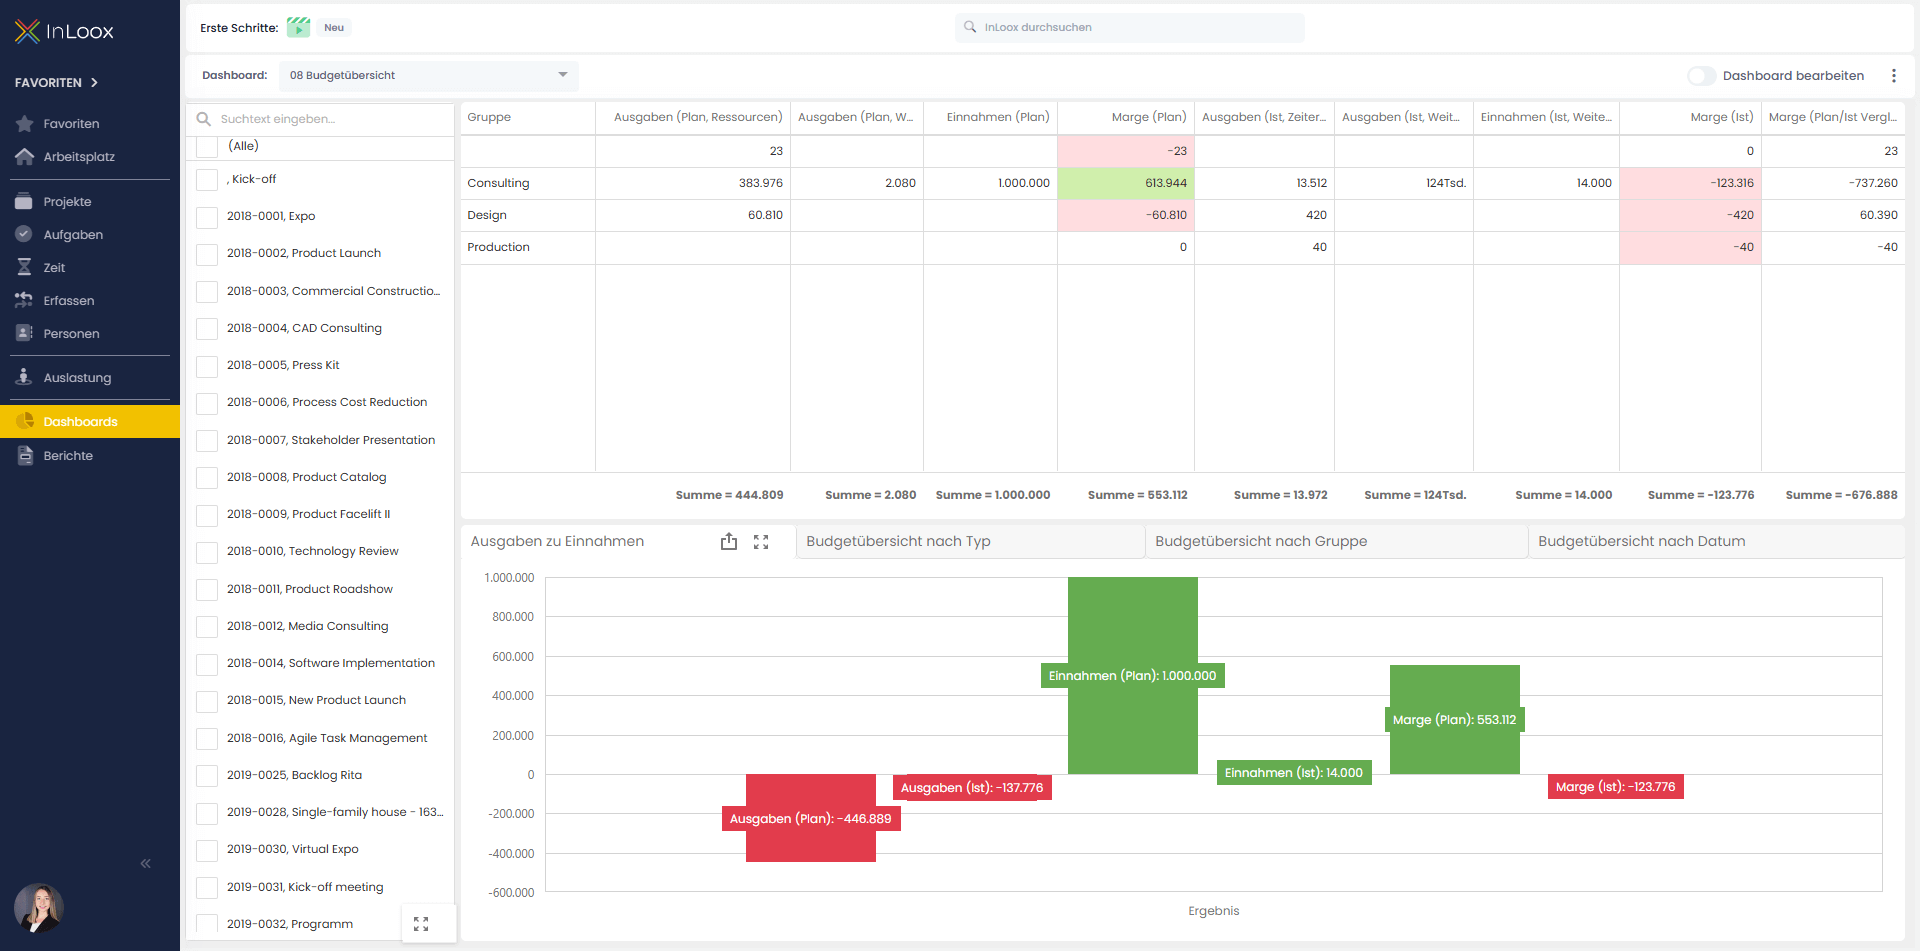 |
| Project Health | Overall health status of your project portfolio | 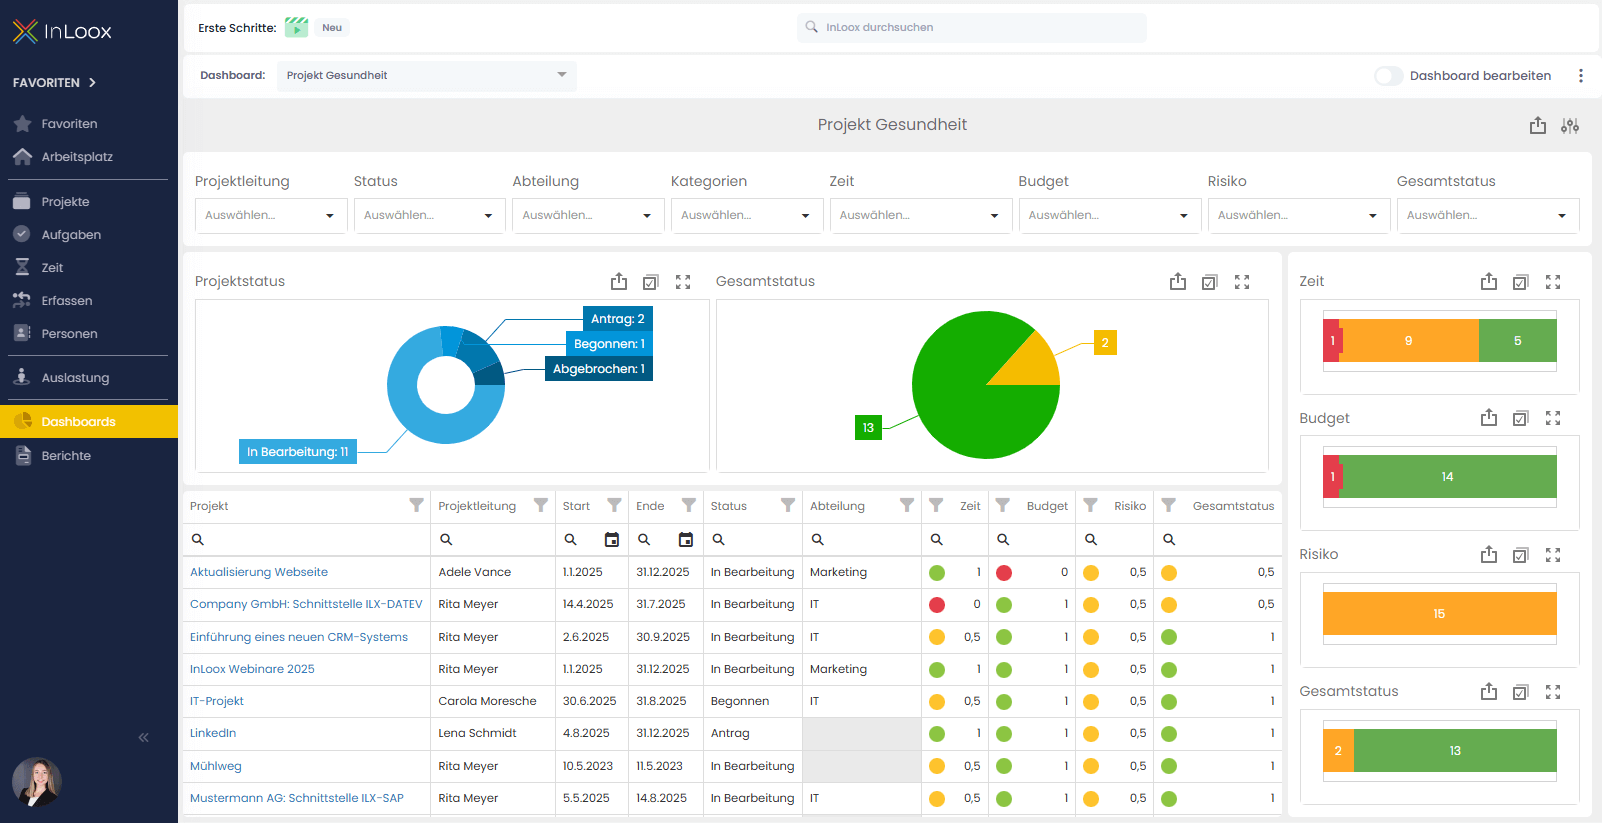 |
Existing customers may still have older dashboard templates. You can download the latest templates from the InLoox website and import them into your environment.
Download & Upload Dashboards
Manage Dashboard Views
- Click the three-dot menu (⋯).
- Select Manage Views.

From here, you can upload and download dashboard views as JSON files.

Export Dashboard Content
To export the dashboard itself (not the view definition), click the export icon and choose one of the following formats:
- Image
- Excel

Dashboard Widgets
Widgets are small, configurable units that display specific data on a dashboard. You can add widgets to any existing dashboard to customize the information shown.
Add Widgets to a Project Dashboard
- Open the project and navigate to the Dashboard tab.
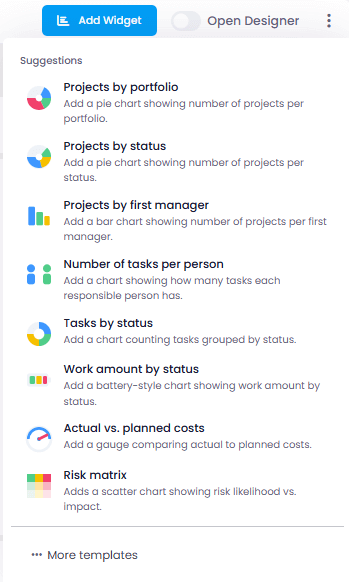
- Click Add Widget in the dashboard toolbar.
- Browse or search the available widgets.
- Select the widget you want to add.
- The widget appears on the dashboard canvas.
- Drag the widget to reposition it.
- Resize the widget by dragging its edges.
- Configure widget-specific settings by clicking the widget's settings icon.
Dashboard Designer
Create a New Dashboard
- Click the three-dot menu (⋯).
- Select New Dashboard.

- Enter a name for the dashboard.
- Click Save.

Set a Global Filter for Dashboards
Available since InLoox 11.17.
Global filters allow you to apply a single filter condition across all widgets on a dashboard. For example, you can exclude archived projects from every widget at once.
- Open the dashboard you want to filter.
- Click the Edit Dashboard slider to enter edit mode.
- Locate the Global Filter option in the toolbar.
- Click Add Filter.
- Select the field you want to filter by (e.g., Project Status).
- Choose the filter condition (e.g., is not equal to).
- Enter or select the filter value (e.g., Archived).
- Click Apply.
- All widgets on the dashboard now reflect the filter.
- Click Save to persist the global filter.
Use global filters to focus your dashboard on active projects, specific departments, or date ranges without editing individual widgets.
Undo & Redo
Available since InLoox 11.16.
The Dashboard Designer supports Undo and Redo actions, allowing you to revert or reapply changes while editing a dashboard.
Customize an Existing Dashboard
- Select the dashboard you want to modify.
- Click the Edit Dashboard slider to enter the Dashboard Designer.
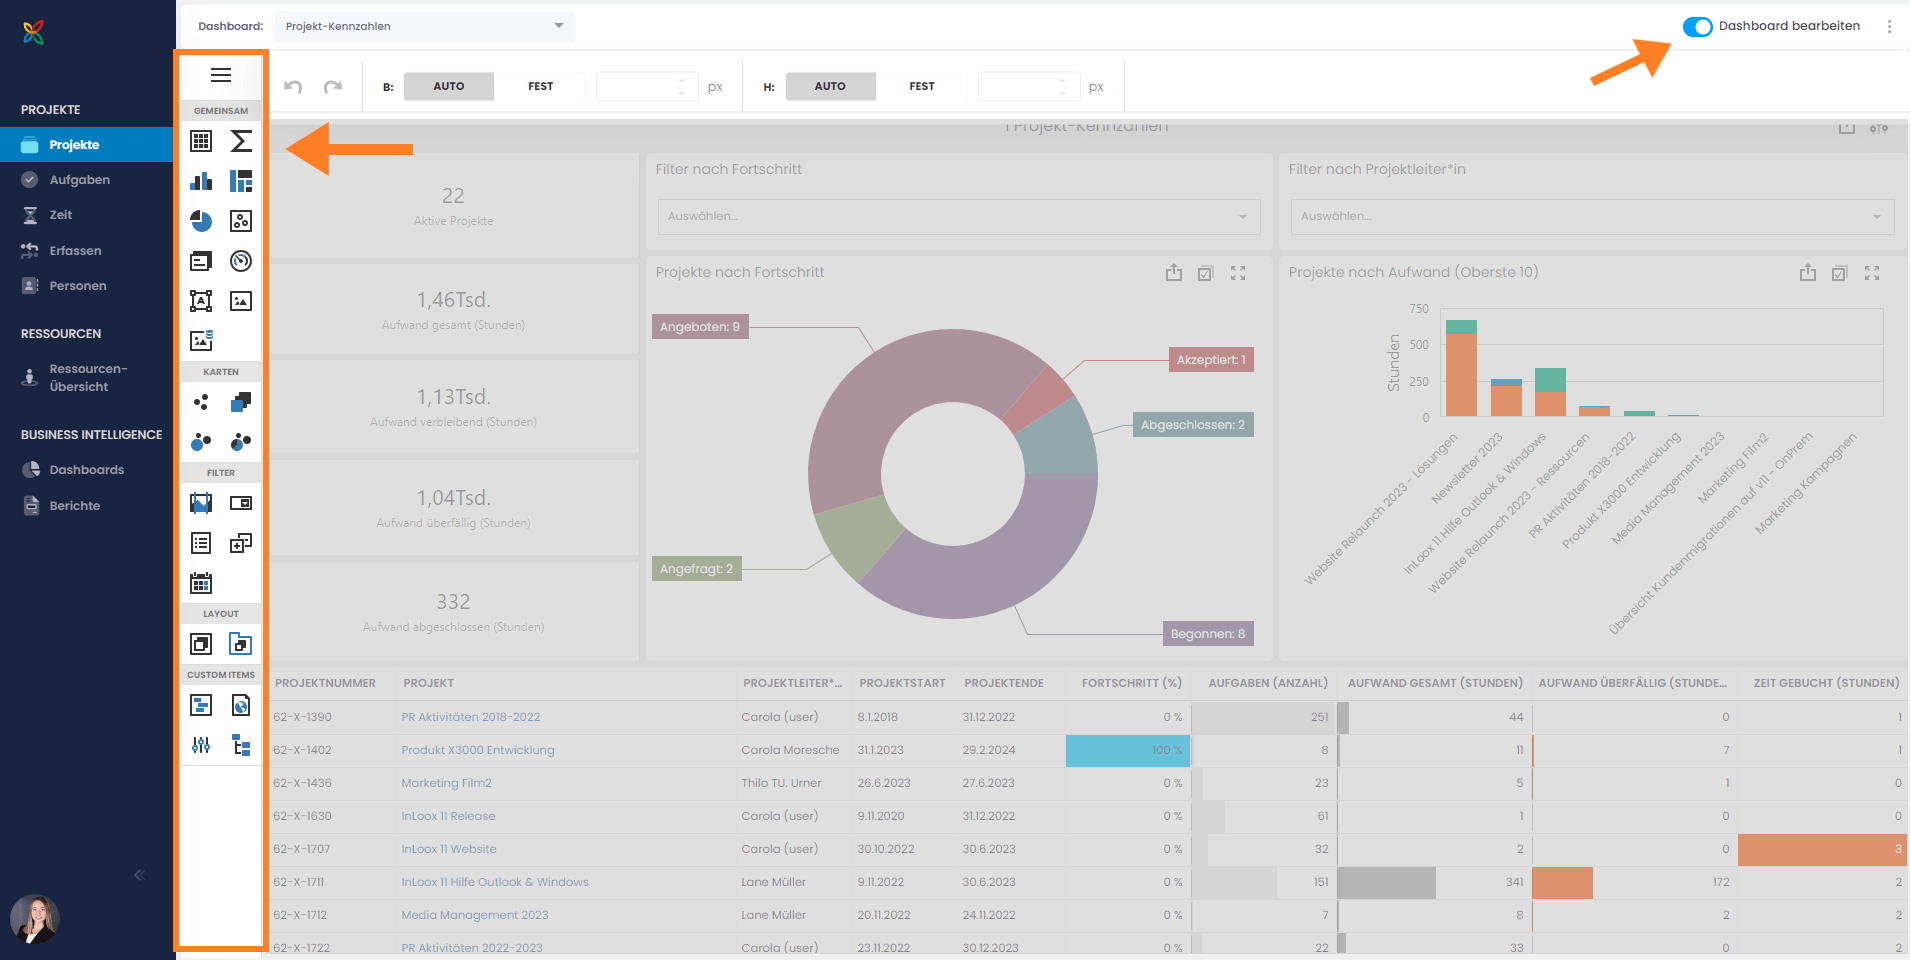
From here, you can add, remove, resize, and rearrange widgets, apply global filters, and configure dashboard settings.